Funnels
How to diagnose which page in a funnel is actually losing the money
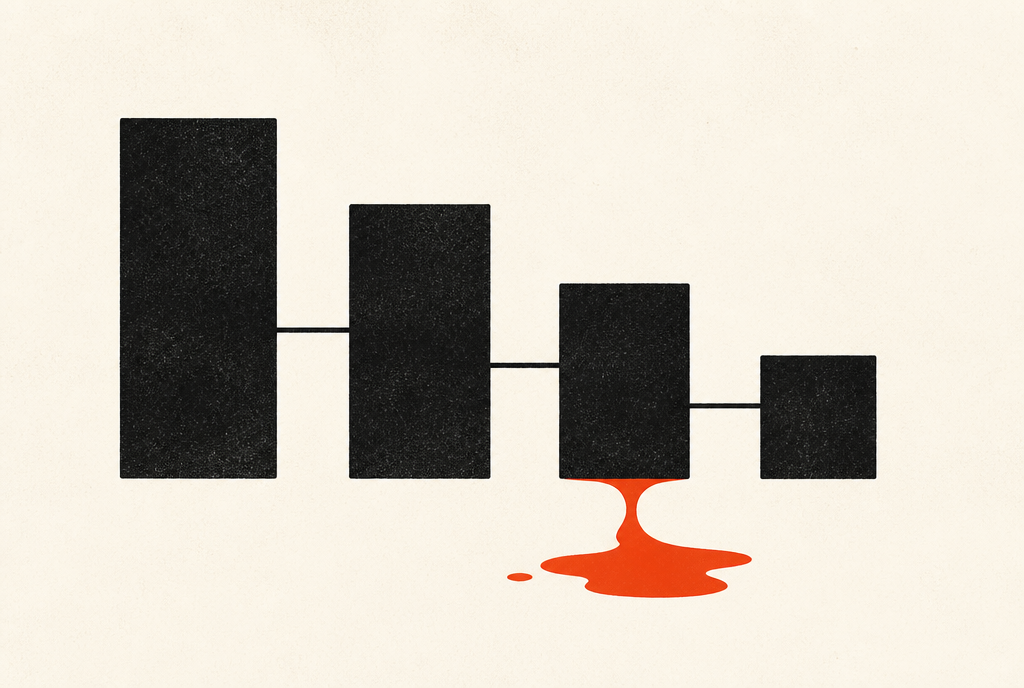
To diagnose funnel leaks, work out what each step should convert at, compare it to what it does convert at, and the gap that costs the most money is your answer. Not the worst percentage — the biggest loss in dollars. A checkout leaking 8% on high-intent buyers is usually worth more than a landing page leaking 40% on cold traffic, and people almost always fix the wrong one.
Every funnel has one step doing most of the damage. It’s rarely the one people think, and it’s almost never the one that looks worst as a percentage.
Here’s how I go about finding it, in the order I actually do it.
Start at the end, not the beginning
The instinct is to start at the ad and work forward. I’d do the opposite, for a practical reason: the further down the funnel a leak is, the more expensive it is per visitor, because you’ve already paid to get that person all the way there.
Someone who bounces off your landing page cost you one click. Someone who abandons at the payment step cost you a click, plus everything that persuaded them, plus a slot in your remarketing. Same person, wildly different loss.
So I start at the money and walk backwards. Checkout, then the page that sends people to checkout, then the page before that, then the ad.
Give every step an expected number
This is the part people skip, and without it the whole exercise is just staring at percentages with no idea whether they’re good.
Before looking at your actual data, write down what each step should do. Not what you hope. What’s normal for this kind of step with this kind of traffic.
You don’t need industry benchmarks for this, and honestly I’d rather you didn’t use them — someone else’s numbers come from a different offer at a different price to a different audience. Use your own history where you have it, and reasoned estimates where you don’t.
The point isn’t precision. The point is that “checkout converts at 60%” means nothing until you’ve decided whether you expected 55% or 85%.
Convert the gaps into dollars
Now compare expected against actual, and here’s the step that changes people’s minds: multiply each gap by the number of people hitting it and the value of a conversion.
A worked example. Say a thousand people land, and you’re selling something at $200.
Your landing page converts to the next step at 30% when you expected 40%. That gap costs you a hundred people at the top. But those people were cold, most were never buying, and the eventual value of that hundred is maybe two or three sales. Call it $500.
Your checkout converts at 55% when you expected 75%. Only two hundred people reach it, so the gap is forty people — but these are people who chose a product, entered details and intended to buy. Forty of them is close to $8,000.
The landing page looks four times worse as a percentage. The checkout is losing you roughly sixteen times more money.
I’ve watched people spend a month redesigning the landing page in that exact situation.
Then go find the mechanical causes
Once you know which step is bleeding, the causes are usually unglamorous.
At checkout it’s nearly always friction or surprise. A cost that appears at the last moment, a required account, a form asking for things that feel unnecessary, or something simply broken on mobile that nobody checked. Go through your own checkout on your phone, on mobile data, as a stranger would. It is remarkable how often that’s the entire investigation.
On a sales page, the usual cause is a promise mismatch. The ad made one argument, the page makes a different one, and the visitor spends their attention reconciling the two instead of being persuaded. Read your top ad and your page back to back and see whether they’re about the same thing.
On a landing page taking cold traffic, the usual cause is asking too much too early.
The measurement trap
One warning, because it wastes a lot of time.
Before you trust any of these numbers, check that they’re real. Broken or double-firing tracking produces conversion rates that look like funnel problems and aren’t. If a step shows a number that seems impossible, assume measurement error before you assume user behaviour, and go verify the event actually fires once.
Anyways. The discipline here is boring but it’s the whole thing: rank by dollars lost, not by the percentage that looks ugliest. The ugly percentage is very good at attracting attention it doesn’t deserve.
Which funnel step should I fix first?
The one losing the most money, which is rarely the one with the worst conversion rate. Multiply each step’s shortfall by the number of people reaching it and the value of a conversion. Late-funnel leaks are usually worth more because you have already paid to get those people there.
What conversion rate should each step of my funnel hit?
Use your own historical data where you have it and reasoned estimates where you do not. Borrowed industry benchmarks are misleading because they come from a different offer at a different price to a different audience. The value is in having written an expectation down before you look.
Why is my checkout conversion rate low?
Almost always friction or surprise: an unexpected cost late in the process, a forced account creation, an over-long form, or something broken on mobile. Completing your own checkout on a phone, on mobile data, often finds the cause in a few minutes.
P.S. — Do the dollar maths before you do anything else. It takes about fifteen minutes and it has changed what people were about to spend a month on more often than any other thing I do.